
Other Works


Medallia’s Digital Experience Analytics (DXA) customers were struggling with where to go next once they discovered an experience issue on their website. They asked for more details in terms of why a specific experience issue is occurring and what steps they need to take to reduce these issues.
Our Data Scientist team worked on this request building a dataset for each experience issue on a web page with relevant page features related to the experience issues. Our Product Leads had some guesses where to place those data insights on DXA, but were not entirely convinced they knew the optimal location or how to format the insights that’s useful to clients. So I recommended that we conduct user research for Program Administrators to learn their typical workflow and mental model. Also, we needed feedback on the language that the dataset that our Data Scientists were able to produce by preparing three design concepts that showed different approaches to displaying insights.
The Problem and Opportunity
{ The Full Story }
There are various ways to present insights. What’s the most effective and useful way to present insights to reduce decision-making fatigue?
04
Not every problem are solved the same way. What are their approach and planning process to reduce user’s experience issues?
03
Different businesses have different goals and priorities. How do Program Managers evaluate which user experience issues to prioritize solving?
02
Program Managers may have different ways of using the DXA platform. How do they currently discover experience issues?
01
I collaborated with Product Leads to recruit research participants who are Program Managers in charge of gathering insights from DXA to disseminate actionable tasks to relevant teams. I wrote the research script and prepared three concept designs. For the research, I combed through the dataset from our Data Scientists to format different ways to present insights.
Our research had these hypotheses and overarching questions:
User Research
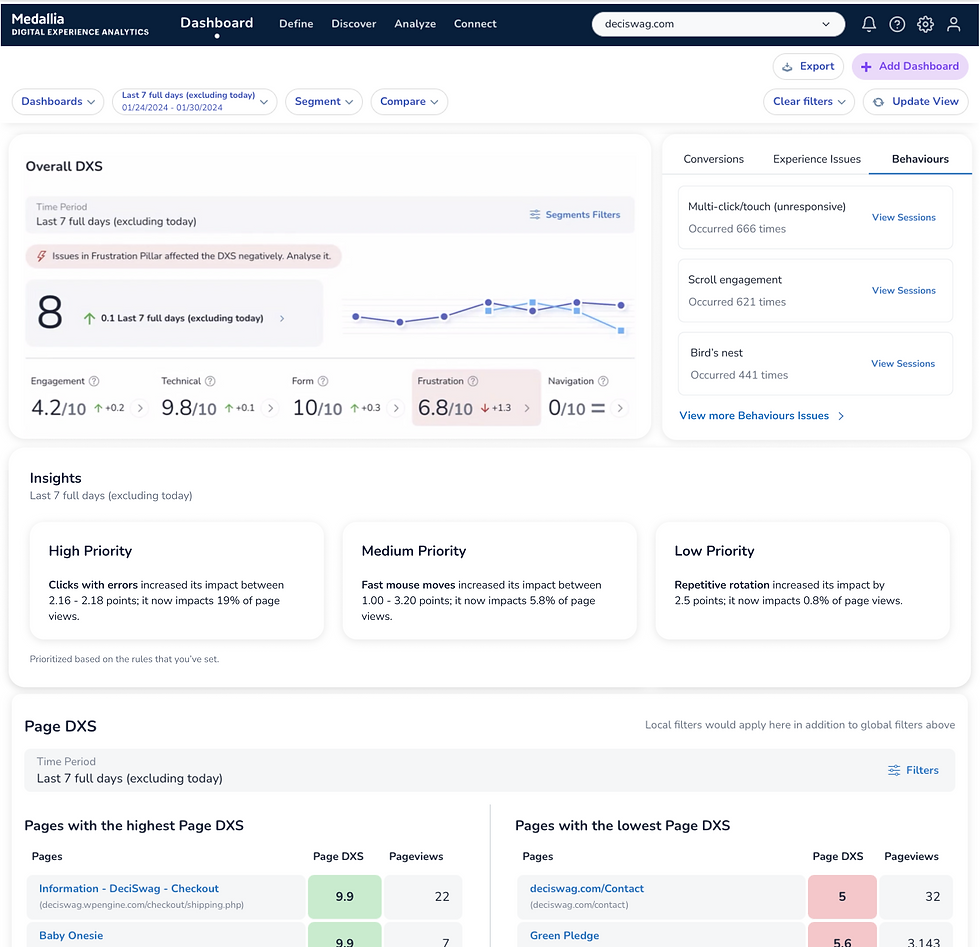
Testing Location: DXA’s primary dashboard where users land after they log on.
Location Details: This page provides overall Digital Experience Scores, lists individual web pages with the top Digital Experience Scores, and web pages with the low Digital Experience Scores.
Testing the Wording in a New Insights Module:
Since this is the landing page after users log on, we tested a new module that categorizes discovered insights based on three priority levels to learn what clients would think and feel about Decibel prioritizing insights for them.
And since this page doesn’t have the same context like the other two concepts, we felt more ambitions to test longer wording: “Repetitive rotation increased its impact by 2.6 points; it now impacts 0.8% of page views” to learn if the clients would find it more useful.
Participants’ Feedback:
The prioritization is confusing to decipher if they’re connected to any particular Pillar Score. There are certain pillar scores that are prioritized based on the volume of customers impacted.
Concept 3
Participants’ Feedback:
Confused as to which Pillar score was generating this experience issue. Participants wanted to read the reasons why a score is low with this experience issue.
Testing Location: DXA’s current page that lists every web pages on a client’s website.
Location Details: Each row is a URL to the respective web page. Included in each row is the different Pillar scores for that web page: Engagement, Form, Technical, Frustration, and Navigation.
Testing the Wording under the new Insights column: Within this page’s context, we tested how useful the insights would be if we listed the Experience Issues found per web page: “Fast mouse moves, Clicks with errors.
Concept 2
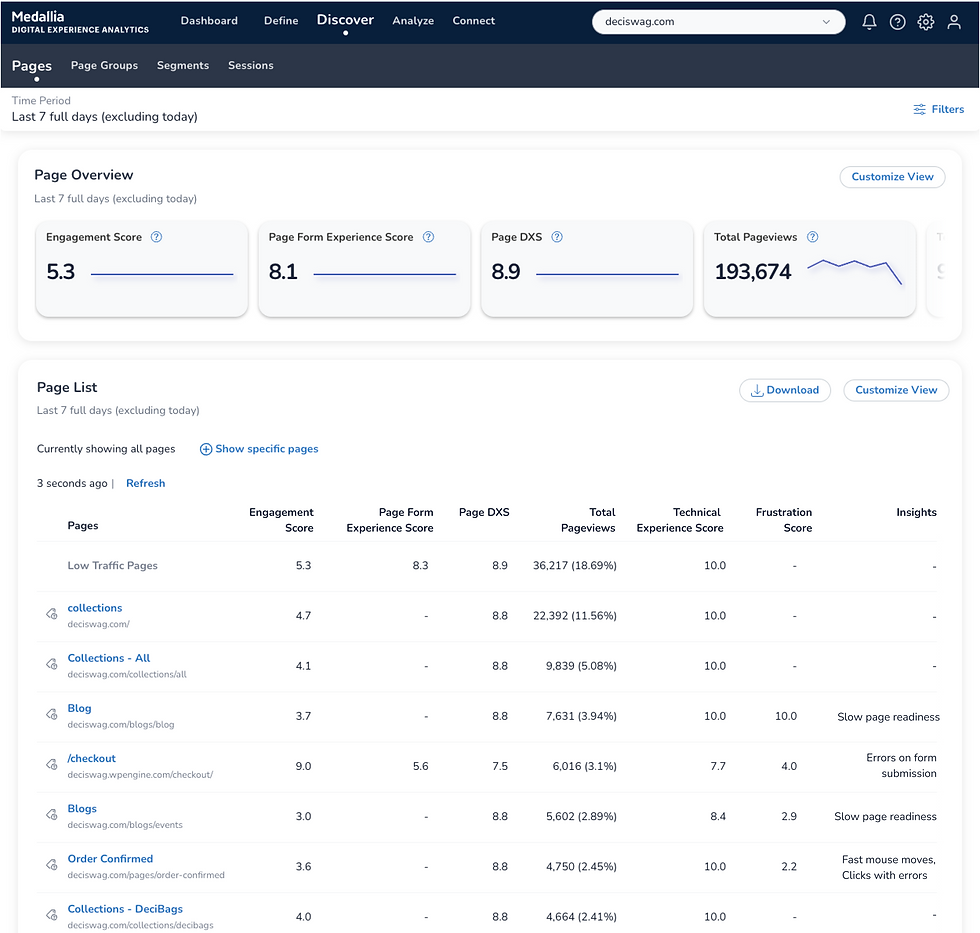
Participants’ Feedback:
Rather see percent improvement or decreased with arrows. They understood that dashes meant that no insights were found, but rather have information that explains how insights are generated.
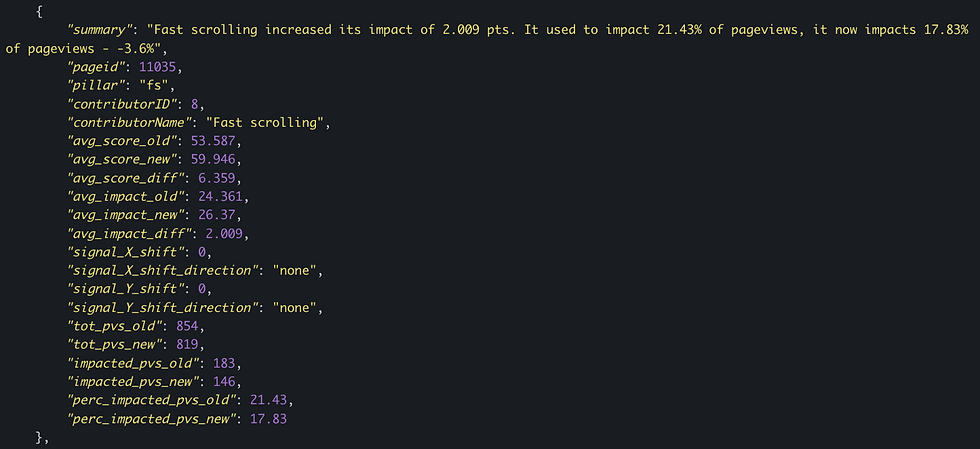
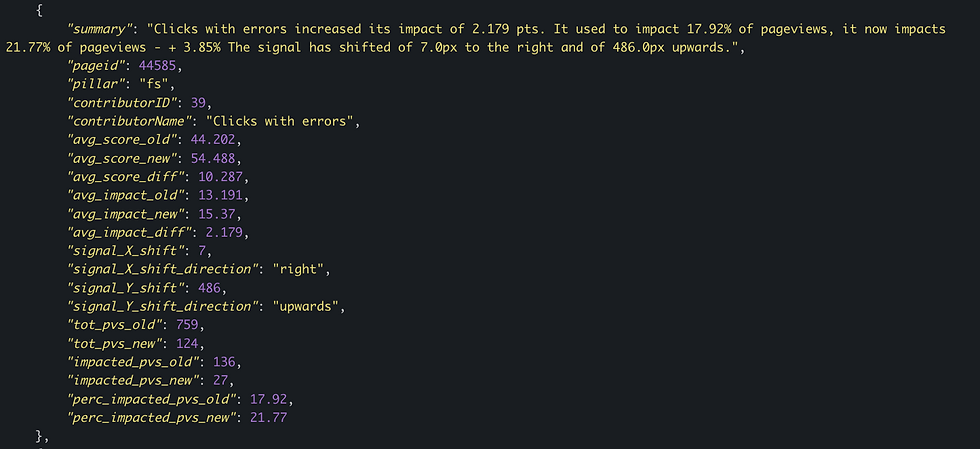
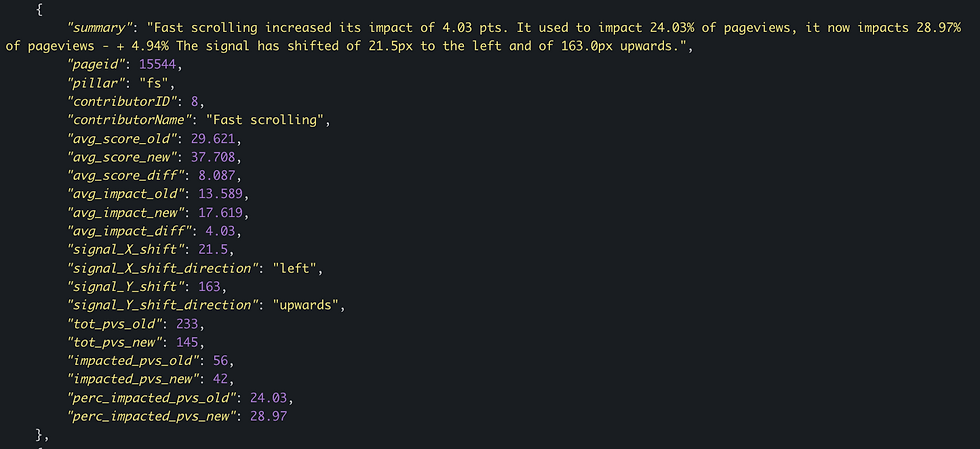
Testing Location: DXA’s current page that lists all found Experience Issues on the client’s website.
Location Details: Each row of Experience Issues includes the affected Pillar, the specific location on the web page, number of customer sessions that were impacted, and a new column we added for Insights we found.
Testing the Wording under the new Insights column: Within this page’s context, we tested how the verbiage would be useful if we showed before and after metrics: “Used to impact 0.60& of page views, now it impacts 1.10%.”
Data Scientist have shared that the dataset wouldn’t account for every found Experience Issues since there’s no data significance. So we also wanted to learn what clients would think and feel when there are no insights for an Experience Issue represented with a dash.

Concept 1
Three Design Concepts
-
Program Managers needs to know a timeline of the experience issue to assess if this is a new trending issue or a persistent issue.
-
Show the volume of customers impacted by the experience issues is a key metrics.
How Program Managers Prioritize
-
Include an explanation by DXA’s terminologies to help Program Managers socialize these terminologies among their teammates who aren’t familiar with using Decibel and immediately recognize the significance of the report.
-
Be more granular with describing experience issues, such as including the specific product pillars, pages, etc… that’s associated with the experience issue or impacting of the issue.
How Program Managers Approach Relevant Teams To Solve Issues
-
Provide how DXA surfaced this insight by explaining the calculation or how this insights were generated.
How to Help Program Managers Understand and Trust the Insights
-
They questioned how the insights were prioritized, based on what rule, and whether they’ll be involved setting up the threshold.
-
They all wanted to know if these cards were clickable and where it would take them. Unanimously, they preferred it takes them to the specific webpage to review session replays.
-
They didn’t care for long and wordy sentences and rather see metrics and pillars highlighted.
Program Managers found Concept 3 the most useful, but had some particular feedback for it
Key Learnings from User Research
We voted for Option 1 with the delta displayed in big number because the calculation have been done for clients to spot the Pillar Score with the biggest change for that time period. There were minor details to adjust such as changing the “occurred XX times” to “XX occurrences,” a hover state that shows a tool tip displaying the Current impact and Previous impact percentages, and include a generic Empty State for situations when users did not turn on insight calculation and haven’t collected at least seven days worth of insights yet.

Option 3 displays the top Pillar Scores impacted by an identified User Experience and displays the Current impact and Past impact on page views.
Option 3

Option 2 displays the top Pillar Scores impacted by an identified User Experience and focuses on the Current Impact it’s making to that Pillar Score.
Option 2

Option 1 displays the top Pillar Scores impacted by an identified User Experience and prominently showcases its Delta within a set time period.
Option 1
After I presented the Key Learnings to Product Leads, we reevaluated the scope of the feature. We identified that our original objective to offer actionable recommendations for Clients cannot be supported by Data Scientists at this time. The Data Scientists needed more time to build the data set to discover and match recommendations. So the Product Leads and I decided we would release a new module on the dashboard as our MVP and first milestone. Then we will revisit the traction and usefulness on this new module and feature after more usage from clients. For the MVP, I incorporated the research learnings into Concept 3 and presented three alternatives to Product Leads.
Redefining the MVP
Since I did not want our MVP to be reported for not being accessible by our Clients and meet the feedback to display Current Impact and Previous Impact on the module. My compromise is to display that Current Impact and Previous Impact on the module without the interaction to see it on-hover or on-click. This recommendation fulfilled all stakeholders’ requirements.
Designed a Compromise

On cursor hover or keyboard-focus, an underline appears below the percentage and occurrences. Users can open and close the tool tip by selecting the underline text with their cursor or hitting the space-bar/enter key to open and esc-key to close.
On-Click Alternative that meets Accessibility Success Criterion

I had an accessibility concern regarding the request to include an on-hover interaction that displays a tool tip with Current Impact and Previous Impact percentages. And checked in with our Accessibility Program Manager who confirmed that this interaction would not be WCAG compatible. To meet WCAG’s success criteria, the interaction would need to change from on-hover to on-click to support keyboard-only and screen reader users the option to trigger the tool tip. However, since the on-hover experience was an omni-present interaction on Decibel prior to me joining the team, the Product Leads did not want to have a different interaction for the MVP.
Accessible Design

I categorized Experience Issues that had similar themes and assigned an icon from our design system befits that issue. I also assigned color treatments from our design system to specialize each these categories.
Assigning Icons for Every Experience Issue
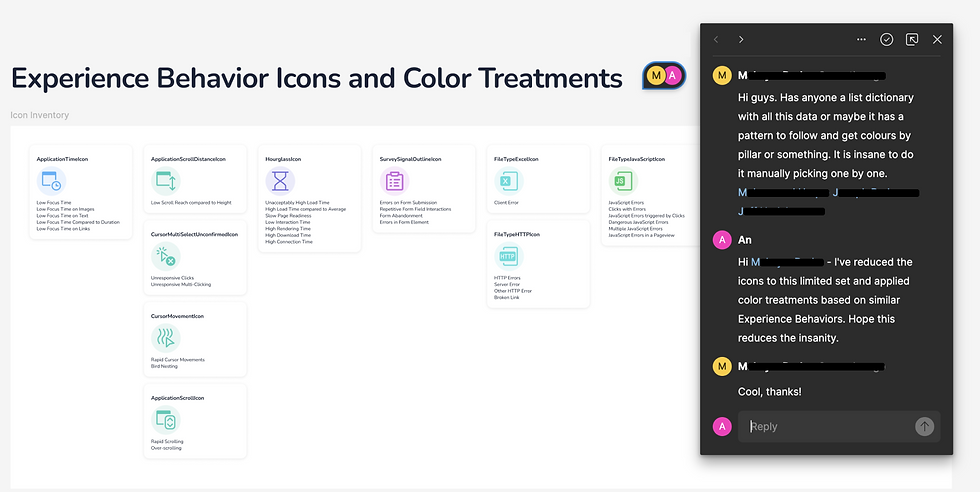
The Product Leads and I met with the Engineering Leads who were already familiar with the project and Data Scientists working on the feature. We reviewed the designs and I incorporated their feedback to support lengthy URLs. The treatment that DXA is to display the URL on one line of text and truncate the end if the length exceeds the given space. Their request is to include icons in our style guide, Alchemy, to assist them with easily locating them on the Alchemy site.
Supporting Development
Our first milestone of Prescriptive Insights is a new module that displays the highest impact to experience issues within a time period set my the Program Manager. It’s located on the main dashboard where users land upon logging onto DXA. Each experience issues shows the Delta of a specific impact score within that time period, the specific URL webpage where the issue is taking place, and a ‘View Session’ button that will take the Program Manager to another page with recordings of all the individual user’s session for further investigation.
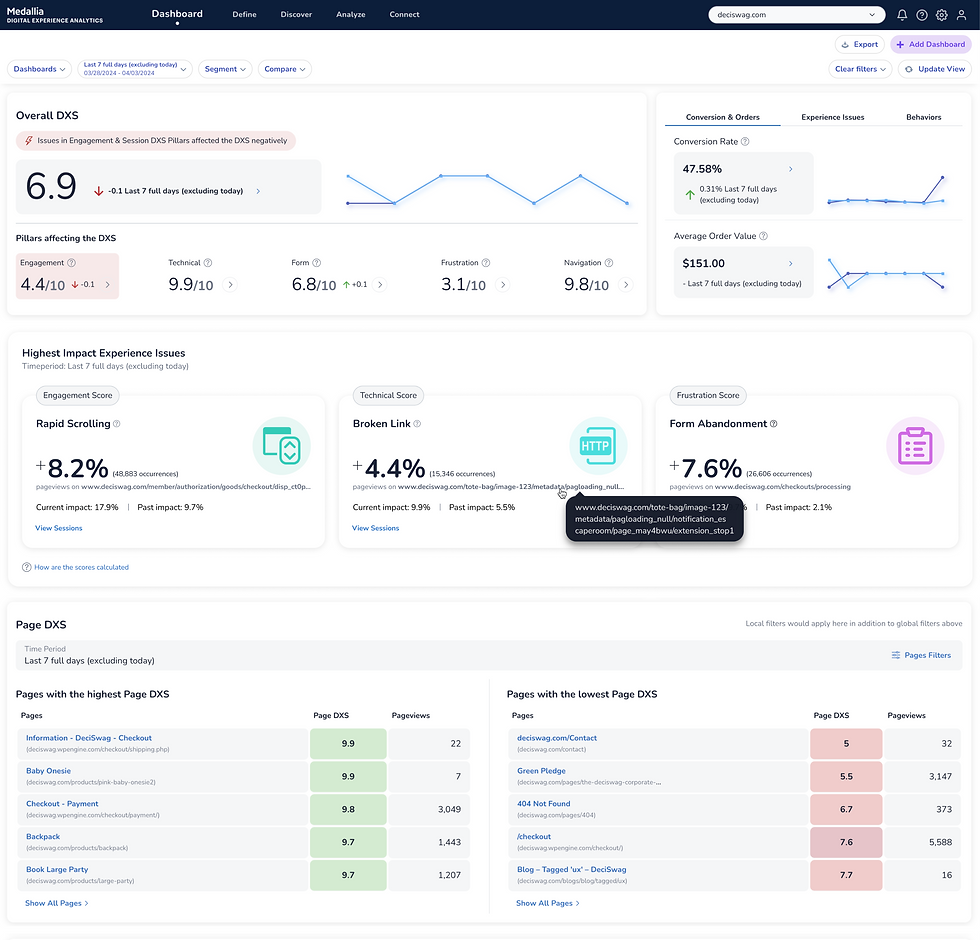
Our MVP

DXA is a powerful platform that helps businesses maintain a great relationship with their customers and provide exceptional services. Being new team member to DXA, I appreciated the trust that the Product Leads had shown me. They followed my recommendation to conduct research and joined every session. The were open to the different design solutions and understanding the WCAG Success Criterion. And I enjoyed meeting DXA’s Clients and learn more about their experiences using the platform.
My Reflection


Design Lead
UX Researcher
{ role }
{ duration }
4 months
{ status }
Milestone 1 complete
Reduce Business Client’s time to value on the Medallia’s Digital Experience Analytics (DXA) platform by generating insights that are causing their customers experience issues.
Prescriptive Insights


Medallia’s Digital Experience Analytics (DXA) tracks and reports user’s experience on digital platforms like websites for businesses. A growing number of clients requested help with learning the top causes impacting their user’s experience. We conducted user research with Program Managers to understand their workflow and received feedback on design concepts. Afterwards, we reevaluated the feature’s scope and divided the development into key milestones. Our first milestone of Prescriptive Insights is a module that displays the highest impact experience issues on the main dashboard with links for a deeper dive into individual user’s sessions.