
Medallia’s Reporting platform is where businesses read verbatim feedback from their customers and respond directly to them regarding unsatisfying experiences. The platform also show businesses how customer scored their experience and overall satisfaction. And most activities on Reporting that are done for customers could be set up for the business’ employees.
Our team received feedback that are People Manager clients were unsatisfied with the Focus Areas modules because it lacked additional insights that would provide context to their team These People Manager clients were primarily managing teams who had none or limited access to Medallia’s Reporting. So the Manager print the report and display them on the bulletin inside employee break room or send an email to their team. And to provide those additional context like Current Score and Previous Score, Managers would take a screen shot of the Focus Areas module or export them into a .pdf, then digitally or manually edit the table by adding new data columns.
The Problem and Opportunity
{ The Full Story }


I had two rounds of iterations and review with Design teammates and my Product Lead. The feedback from Design is to reduce the amount of colors to make the module less jarring. The feedback from Product is to continue exploring separate modules for ‘Opportunities’ Focus Areas and ‘Strengths’ Focus Areas. We agreed that the heat-map are better applied on Deltas metrics and don’t apply color highlight on Scores.



Our Original Approach and Explorations
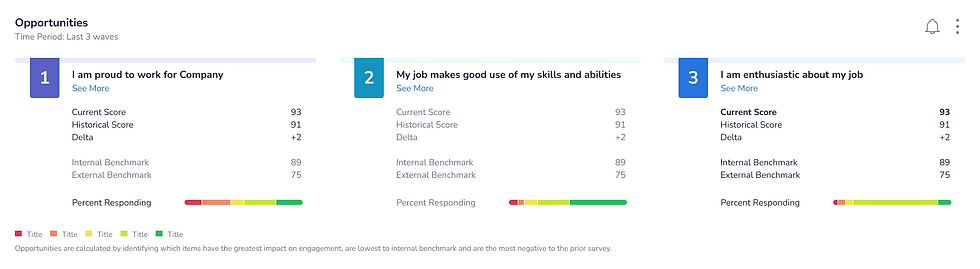
Our goal on the Medallia Reporting Team is remove any blockers preventing our Clients from easily consuming insights about their customers and employees. We want our Clients to easily learn feedback about their services and organization, so they can build stronger relationships with their customers and employees. Our original scope was to add new visualization to Focus Areas to show two additional data points: Current Score and Benchmark to provide context for People Managers and their teams. Our secondary goal was ti implement heat map to the delta between the two scores and add configurations for two more benchmark types for internal and external metrics.


Adding our Segmented Control to the Module
The placement of the Segmented Control component is on the top right of Reporting modules. It’s purpose is to display different views in an experience by toggling on the component. We added the Segment Control to the Focus Areas module so we can include additional views of the two new configurations for Focus Areas.
{ Example when the Segmented Control switches to a Ranking Visualization }
{ Example when the Segmented Control switches to a Table Visualization }
{ Example when the Segmented Control switches to a Distribution Bar Visualization }
The Designs were getting cluttered with colors from the heat map and from the original Focus Areas configuration’s 1, 2, 3 visuals. Secondly, working withing the original configuration limited our space to consider lengthy survey questions and multiple data points. The Product Lead and I revisited our original approach. We decided that instead of adding new visualizations and data points to the original Focus Areas module, we would keep the original Focus Areas visualization and add two more configurations of the insights. And People Managers could have these new configurations added as other view options. Our new approach is based on the attitude that by providing People Manager new configurations of the Focus Areas insights and options to see the Focus Areas in different views, we would supply them with the data details that they’ve requested without tampering with the existing configuration for users who do prefer the old visualization.
Reevaluating Our Approach

Creating Guidelines for the Distribution Bar’s New Configuration
We created guides on the spacing between the bar and the value below. As well as how users can interact with the Distribution Bar using a mouse or keyboard. We also addressed how to display value in various scenarios if one slice of the bar are too small and if multiple slices of the bar are side by side with a popover.

h5{ The Original Distribution Bar Component }
One of our new configuration for Focus Areas is a Distribution Bar of employee’s Net Promoter Score (NPS). Our Distribution Bar was not originally designed to display values below. We would include a table of the distributed score wherever the Distribution Bars were used. However, a growing number of Customers expressed losing context and information whenever they see the Distribution Bar and the Table. Customers requested that we display the values below the Distribution Bar. This is a familiar data visualization treatment of a Distribution Bar, so I reached out to our Style Guide Developers to create a new configuration of the Distribution Bar component with values below.
Updating the Distribution Bar Component
After we’ve decided on our new approach approach, prepared new configuration of the Distribution Bar, and mocked the final Reporting Designs, we had the last bit of Configuration Set Up to design. This effort was a collaboration with our Engineering Lead who supported the Product Lead and I with their understanding and familiarity with Reporting’s insights, calculation, and module configuration.
Last Bit of Module Configuration Setup


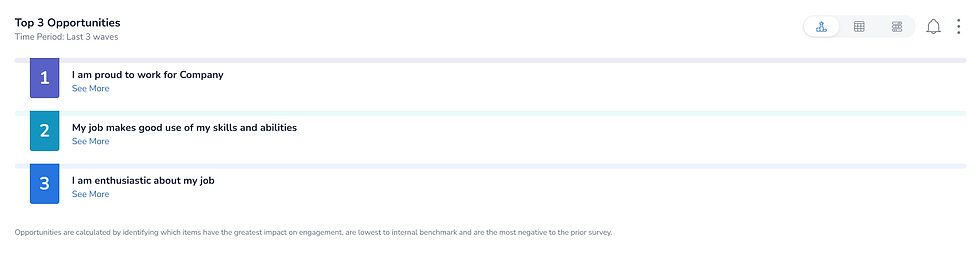
Our New Focus Areas Module have two additional views to supply the additional data details that People Manager have been manually adding to their report. I maintained the ranking 1, 2, 3 for the new configurations because it added consistency and context when switching to the new views from the original view. However, I did not apply the same visual treatment to the 1, 2, 3 and muted the ranking so the colors wouldn’t compete for focus with the heat-map colors on the Benchmark and Distribution Bar color.
People Manager can select one of these views or all of them to export into a .pdf to email or print out for their teams. Our Design System meets color contrast rules, so if People Managers are unable to print with color ink, the report will maintain color contrast when printed in black and white too. However, we cannot account for low-ink.
Our Updated Focus Areas Module
{ Two New Additional Views with Relevant Data Details }
Upon hearing that People Manager were manually adding insights to the Focus Areas module was hard to hear, but I appreciated the feedback to learn their reasons and conditions in which they’re distributing the reports to their teams. The feedback reminds me that there’s always more use cases that we’ll continue to uncover. Additionally, this project offered me a wonderful opportunity to expand our Style Guide and Distribution Bar component. I always welcome the opportunity to identify new use cases to improve our Style Guide and components.
My Reflection

Reduce People Manager’s time and effort preparing reports of the Focus Areas module for their teams by adding two new configurations with relevant data details.
Focus Areas

{ role }
Design Lead
{ duration }
2 months
{ status }
Released
Other Works


{ The Two Newly Added Configurations for the Focus Areas module }
